PROJECT SPOTLIGHT: UX Design & Research, Project Management
Visual Service
Digital software for HVAC industry professionals
Project Overview
Heating, ventilation, and air conditioning (HVAC) professionals provide essential services to millions of people around the world. When these professionals maintain and repair HVAC systems large and small, they rely on precise, cutting-edge software and devices for tracking data and systems information. This project included the creation of both a mobile app for field-based HVAC professionals and desktop software for office-based field coordinators.

Client: IHACI
The Visual Service project was supported by the International Heating and Air Conditioning Industries non-profit trade organization, also known as IHACI, as well as experienced HVAC professionals. Visit the IHACI Website.
Agency: Halftone Digital
Small but mighty Twin Cities digital design and experience agency providing a full spectrum of services including branding, interaction design, and user experience design. Known for inclusive, intuitive, and empathetic approaches to projects. Visit the Halftone Digital Website.

According to the U.S. Bureau of Labor Statistics, in May 2021 there were an estimated 356,960 workers in the Heating, Air Conditioning, and Refrigeration Mechanics and Installers industry in the United States.
Source: U.S. Bureau of Labor Statistics, 49-9021 Heating, Air Conditioning, and Refrigeration Mechanics and Installers
In order to learn about the complex experiences of HVAC field technicians and contractors, an extensive amount of research about the HVAC field was needed for this project. It was also important for us to examine the types of environments these HVAC professionals work in and have an understanding of the systems, tools, and instruments that are used in industry work.
HVAC Industry Research
Image Credit: U.S. Bureau of Labor Statistics
Image Credit: Visual Service/IHACI
Research, Testing, & Evaluation
A variety of research methods were utilized during the Visual Service project.
As described in the previous section, we dug in and conducted extensive industry research.
Usability testing of our wireframes and prototypes had a strong impact on our design decisions throughout the project.
We were able to conduct several formal and informal interviews with subject matter experts on a weekly basis.
Tools like Maze, Typeform, and Loom were helpful when we conducted more specific and focused surveys and A/B testing.
Through these differing explorations, we were able to gain a deep understanding of the needs of both HVAC field-based workers and HVAC service managers.

According to market research and consulting firm, Grand View Research, the global HVAC systems market size was estimated at USD 136.25 billion in 2021 and was expected to reach USD 143.7 billion in 2022.
Source: Grand View Research, Global HVAC Systems Market Size Report, 2022-2030
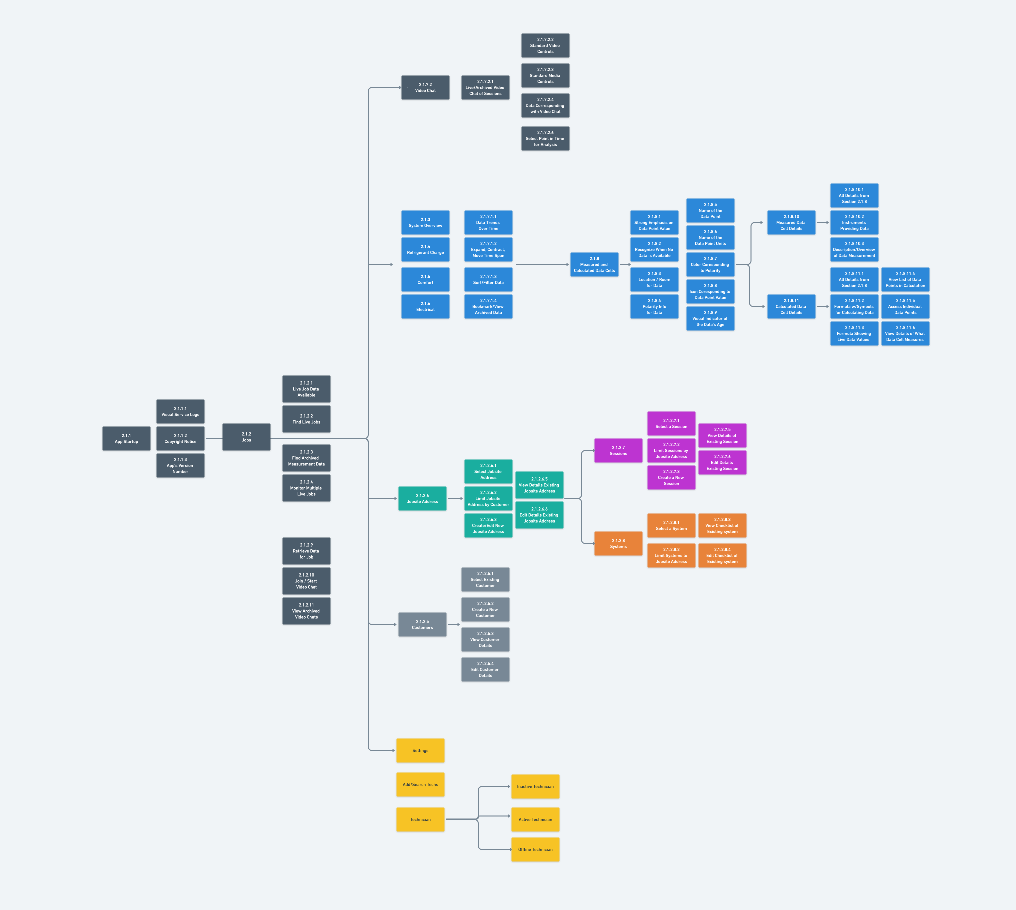
Information Architecture
We created sitemaps and flowcharts to help us organize our approach to wireframing and prototyping screens for both mobile and desktop apps. Referencing our IA documentation allowed us to better understand the structure of the two future software applications and provided a way for us to track where individual screens we were designing fit into the overall structure of each app. The Whimsical application was particularly helpful with our IA documentation.


Early Design Stages
Branding, logo creation, and other graphic design services for Visual Service were also a part of our project. Our lead graphic designer and owner at Halftone was responsible for creating these logos.
Branding
Sketching, Sketching, and More Sketching
Whiteboarding sample screens, possible user flows, preliminary IA documentation, and beyond was a daily practice for the Visual Service project. It was so helpful to work through the tough questions and design challenges using this useful method.


Wireframes
After sketching, we moved to low- and mid-fidelity wireframes using the Sketch app as well as the Whimsical platform. It was interesting to test out how these two platforms helped us during the early design stages.

Interactive and Visual Design
Mobile App for Field Technicians
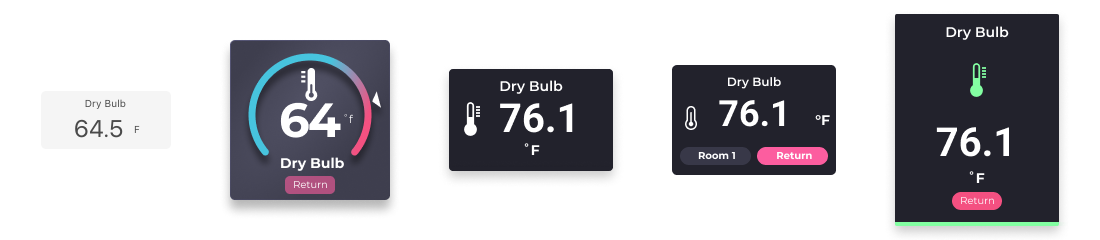
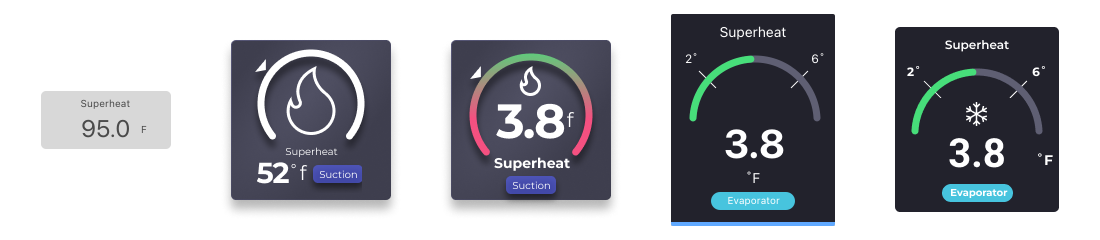
Anatomy of Measurements
For HVAC field technicians, the magic begins with measurements. These measurements provide information and data about the HVAC systems that technicians are assigned to analyze, manage, maintain, and repair. We spent a good amount of time iterating the measurement instances before moving forward with other areas of the mobile app.
Measurement Sections
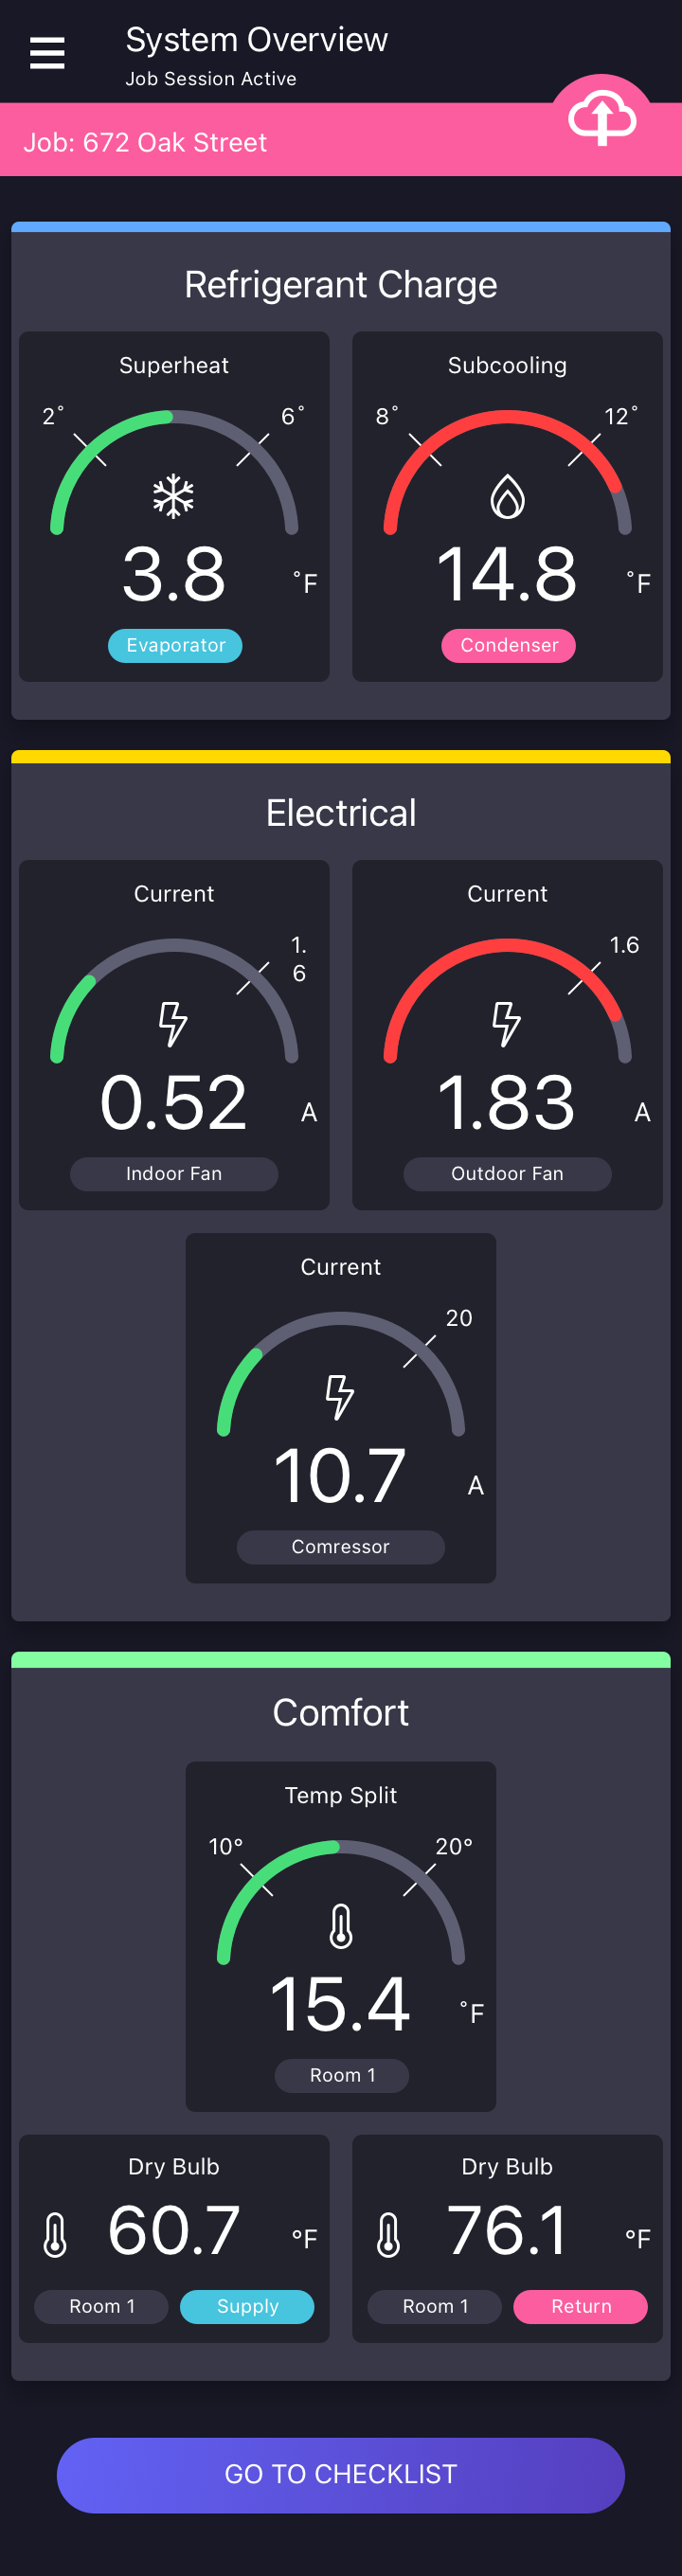


As described in the section just above, getting the measurement data and information representations right were extremely important for this mobile app. These sections represent various categories of measurement types that the field technician would use while servicing an HVAC system.
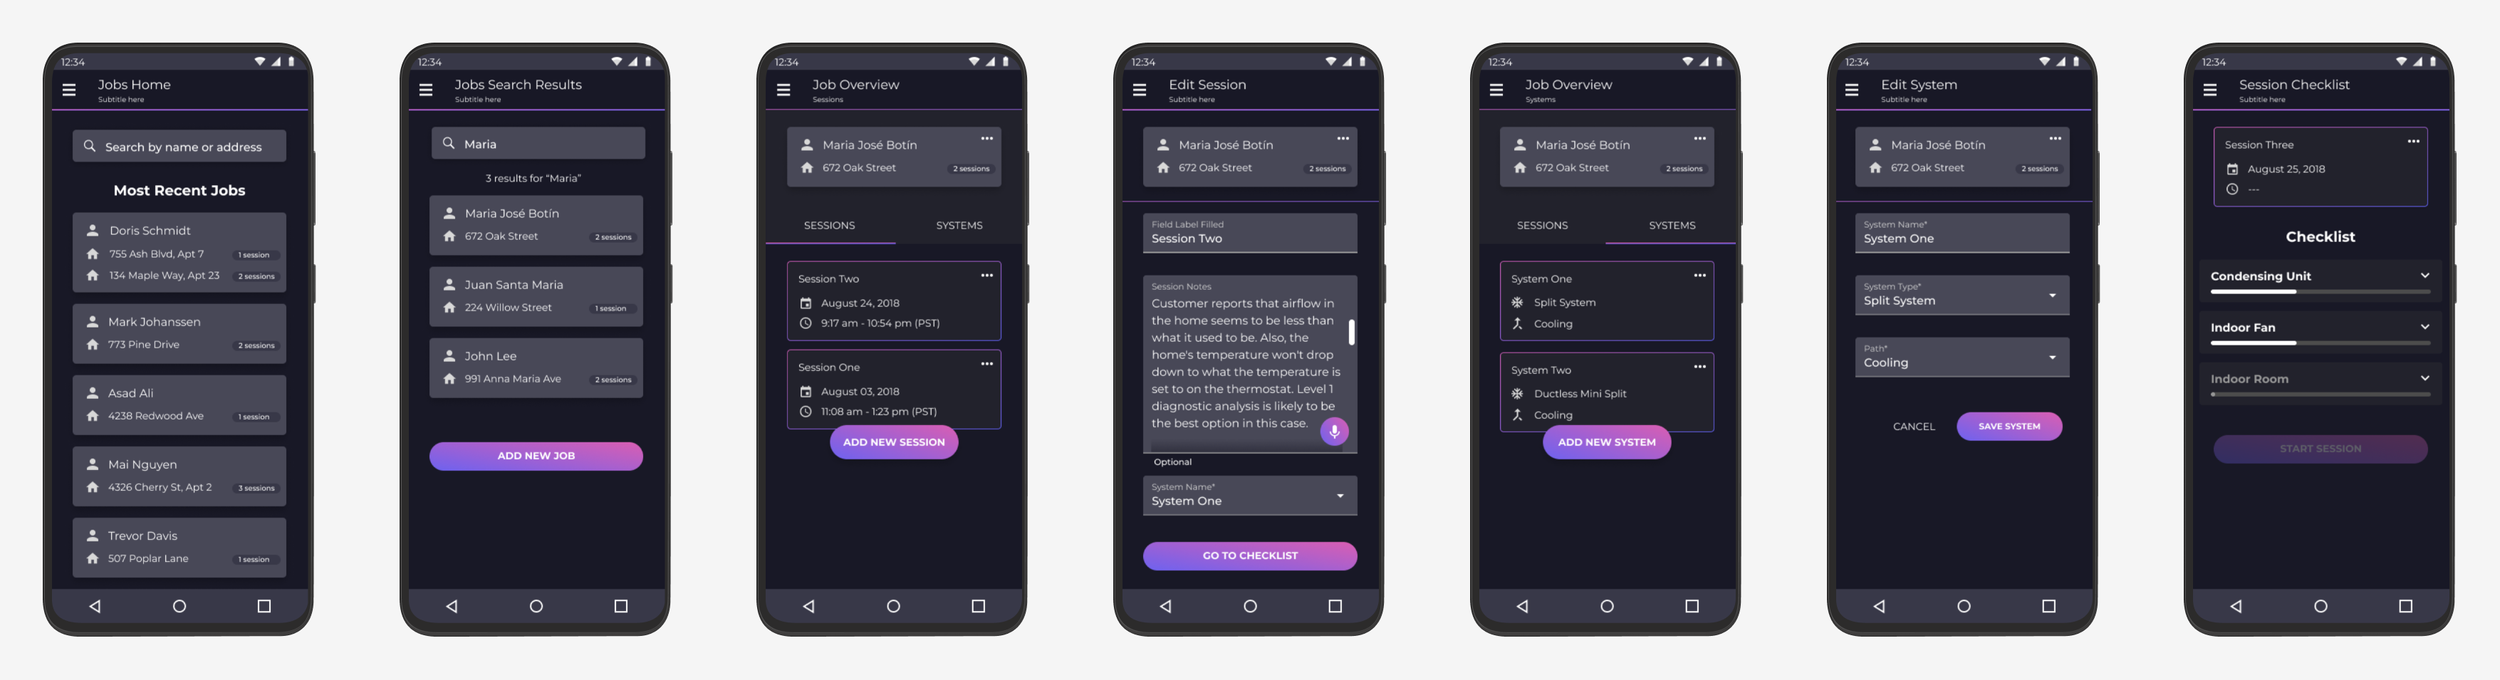
Management of Jobs and Sessions


For this section of the mobile app, it was important to keep track of the daily HVAC jobs that a field technician would be assigned to work on. When the field tech is onsite at a job site, they start one or more sessions while servicing the particular HVAC system.
Desktop App for Service Managers
Main Dashboard
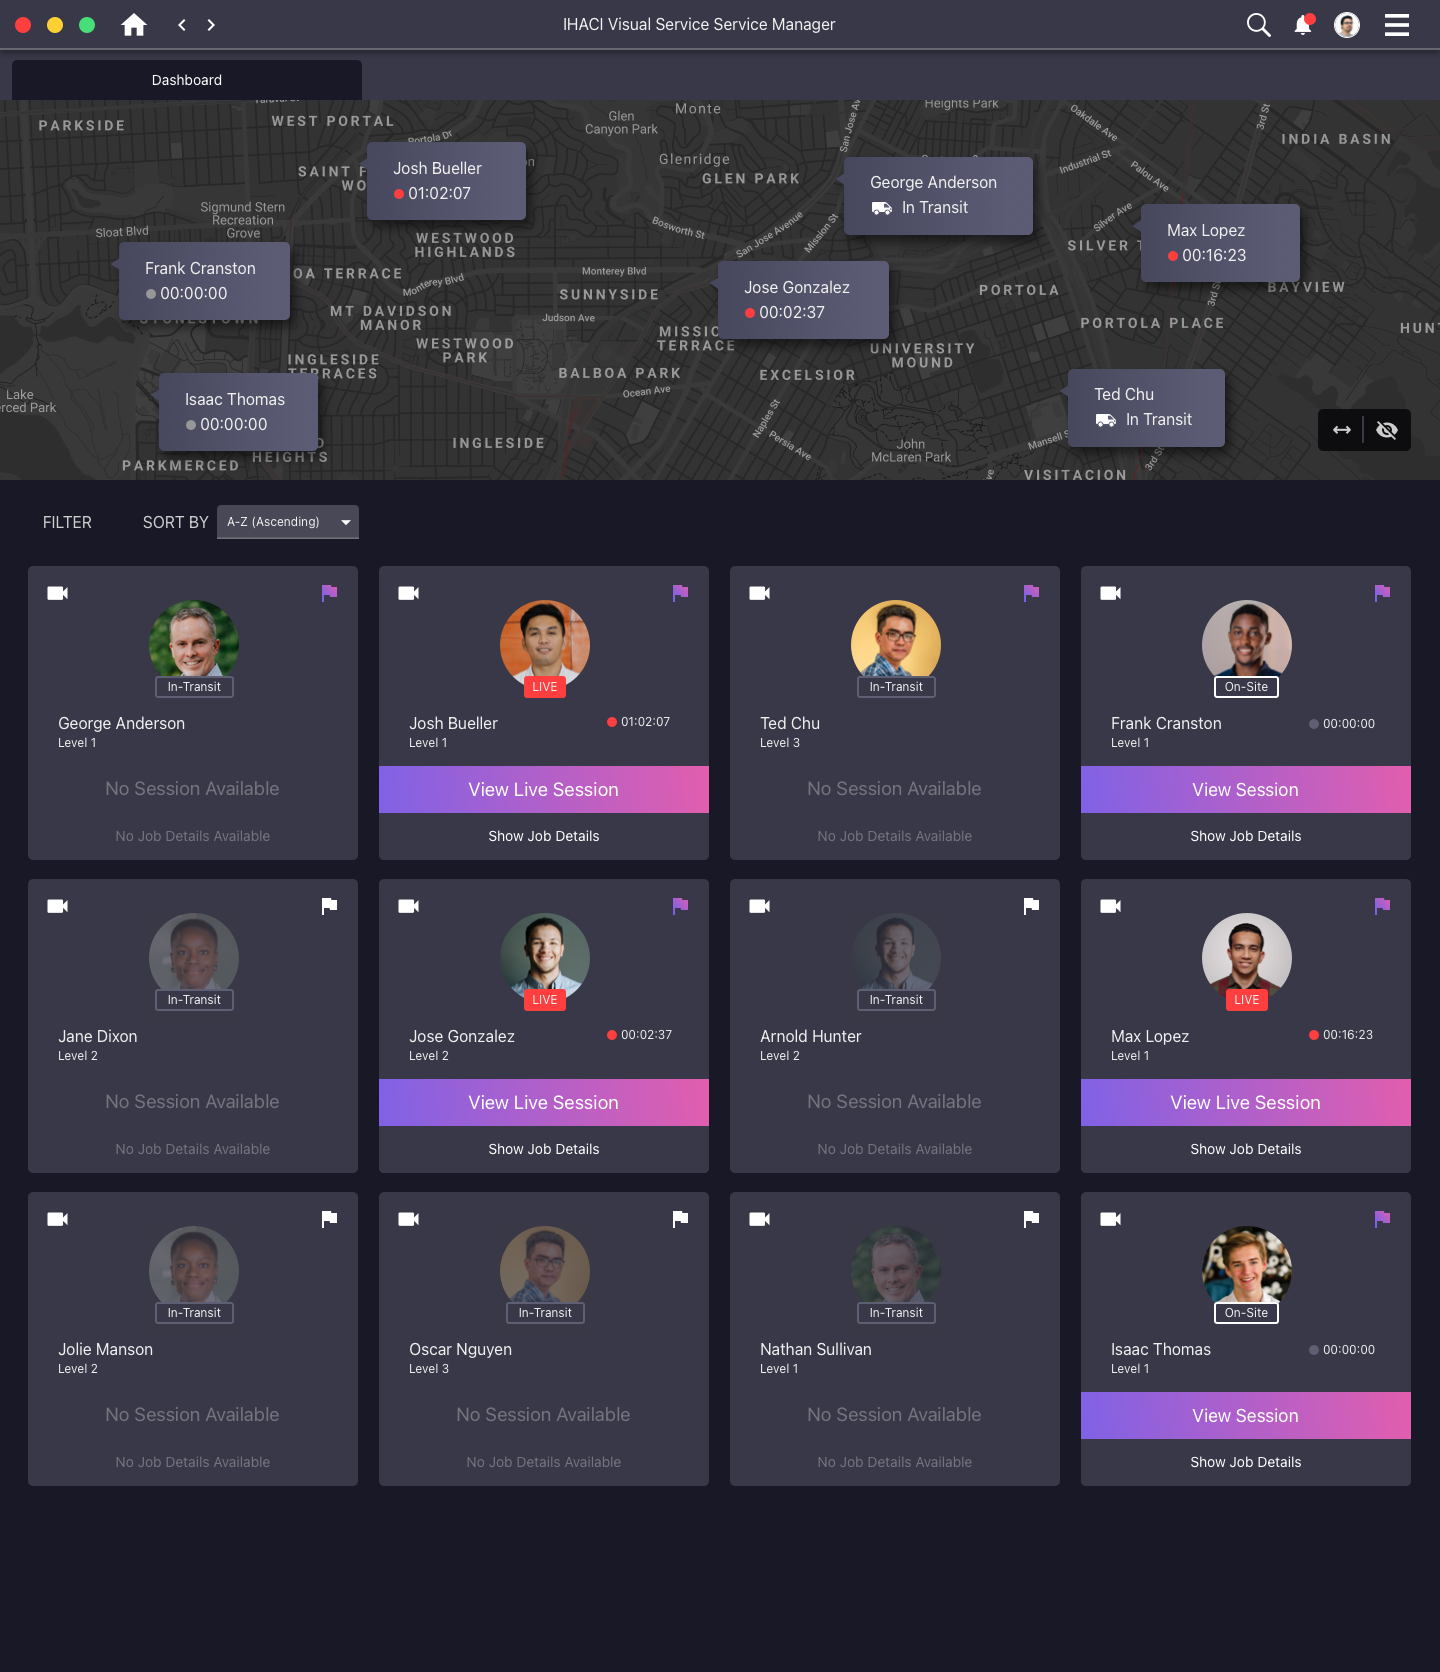
With the Visual Service main dashboard, Service managers for HVAC companies track their technicians working in the field. They can view the tech’s geographic location as well as information and data related to the HVAC system being serviced. This helps with job management across the company and also allows them to use their expertise to train groups of field technicians.
Session Dashboard

The Session Dashboard acts as a vital connection piece in the oftentimes complex world of HVAC system servicing and management. Service managers are able to see the information and data that field technicians are seeing. Multiple sessions can be opened at the same time with video calling and real-time chatting as options for contact with individual technicians.
Additional Visual Service Designs
Customer Report

When work ends, customers benefit from a detailed report that explains services and updates to their HVAC systems.
Marketing Site

In order to encourage support and develop interest in the mobile and desktop systems, we also created a marketing site for Visual Service.
Lesson Learned
To say that I was immersed in the HVAC world during the Visual Service project is an understatement. The most important lesson I learned during this project was that it is vital to learn as much as possible about the environment and culture of the people who will be using your digital product.
Next Steps
The next step for Visual Service was for the IHACI organization to bring the apps to an industry-wide HVAC trade conference. Though Visual Service was put on hold and I moved on to other projects if I had more time to work on these digital products I would have started a thorough round of usability testing with HVAC professionals for each of the apps.
